Throughout the course of the pandemic, we have seen the OTT (Over-The-Top) and CTV (Connected TV) space soar to new heights as the majority of the global population were confined to their homes.
Our latest blog breaks down 80 of the most captivating OTT and Connected TV statistics which tell an important story about the growth in this space as well as how much of a powerhouse it is set to become in the near future.
How COVID-19 has accelerated this space
- In 2020, TV viewership increased dramatically, with the UK seeing a 62% increase in streaming time (Samsung Ads Decoding the On Demand TV Landscape white paper)
- In Q4 of 2020, the UK on average watched 88 hours of OTT content per month (Samsung Ads Decoding the On Demand TV Landscape white paper)
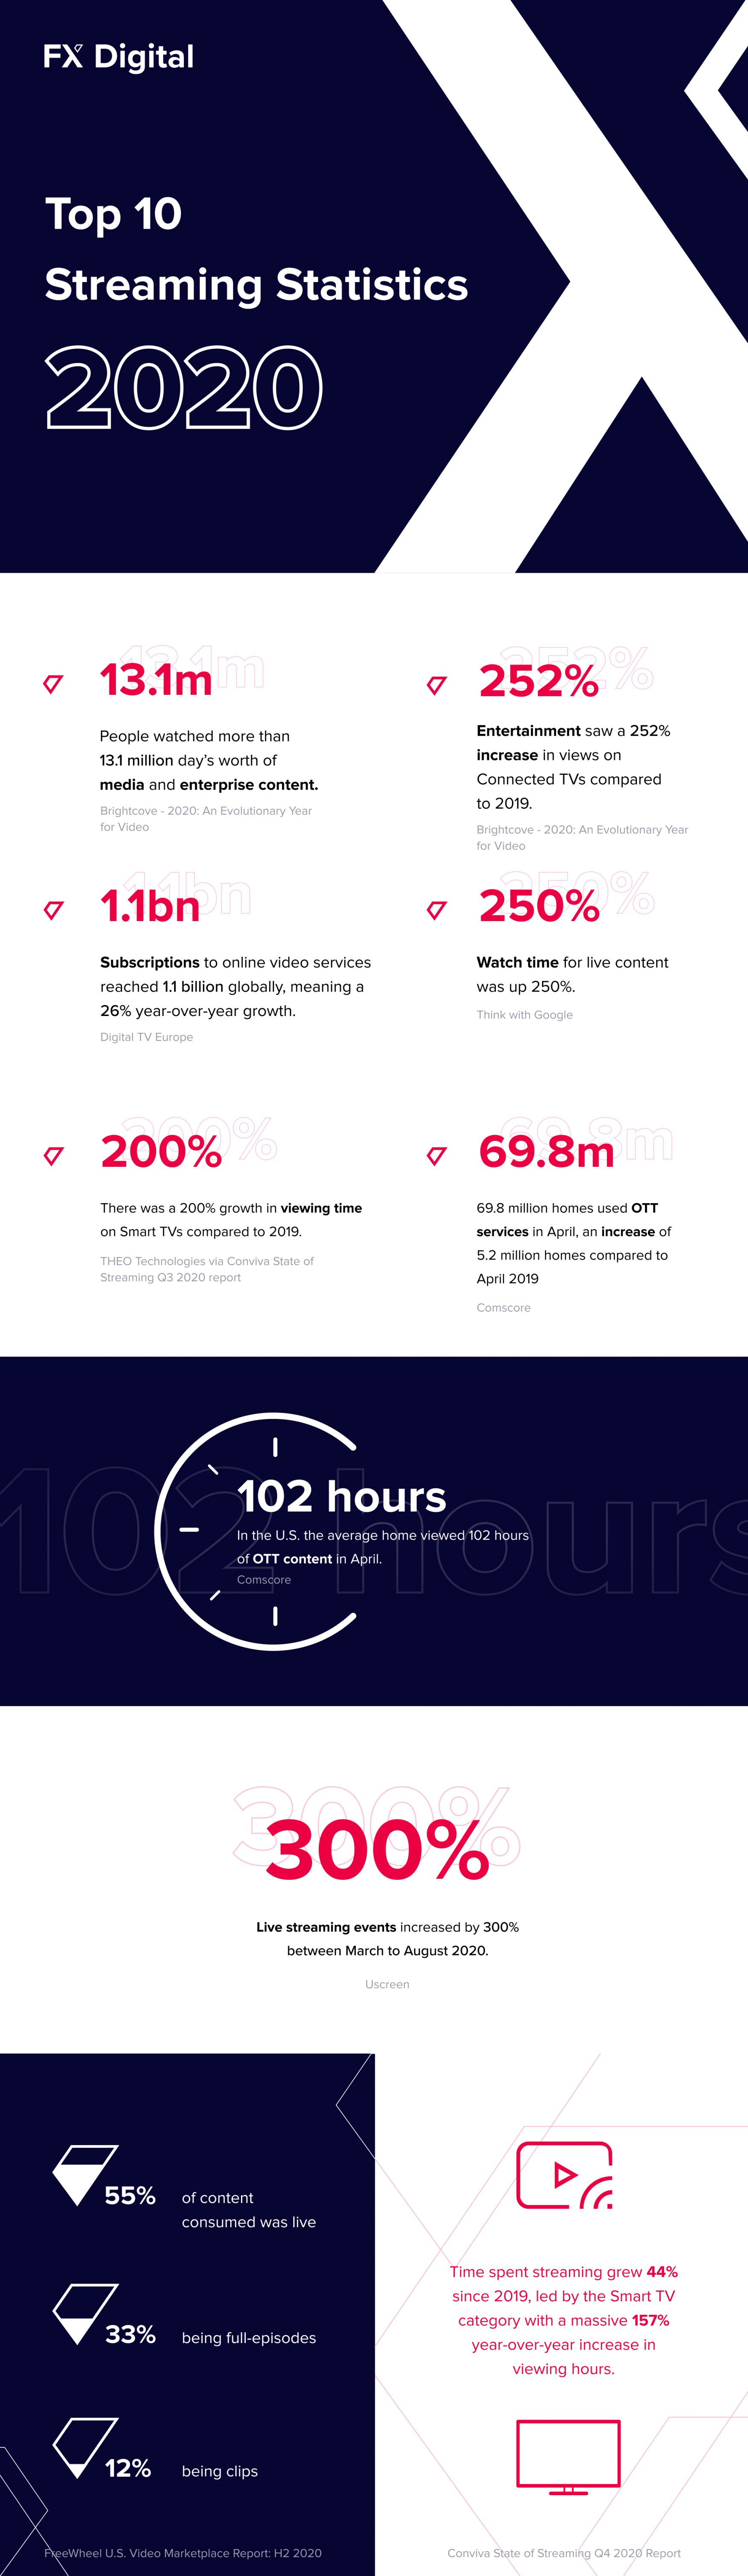
- In 2020, people watched more than 13.1 million days’ worth of media and enterprise content (Brightcove – 2020: An Evolutionary Year for Video)
- Entertainment saw a 252% increase in views on Connected TVs in 2020 compared to 2019 (Brightcove – 2020: An Evolutionary Year for Video)
- Between January and August 2020, the number of live-streamed events hosted increased by 1468% (Uscreen)
- April 2020 saw video views increase by 75% compared to last year (Brightcove)
- In 2020, subscriptions to online video services reached 1.1 billion globally, meaning a 26% year-over-year growth (Digital TV Europe)
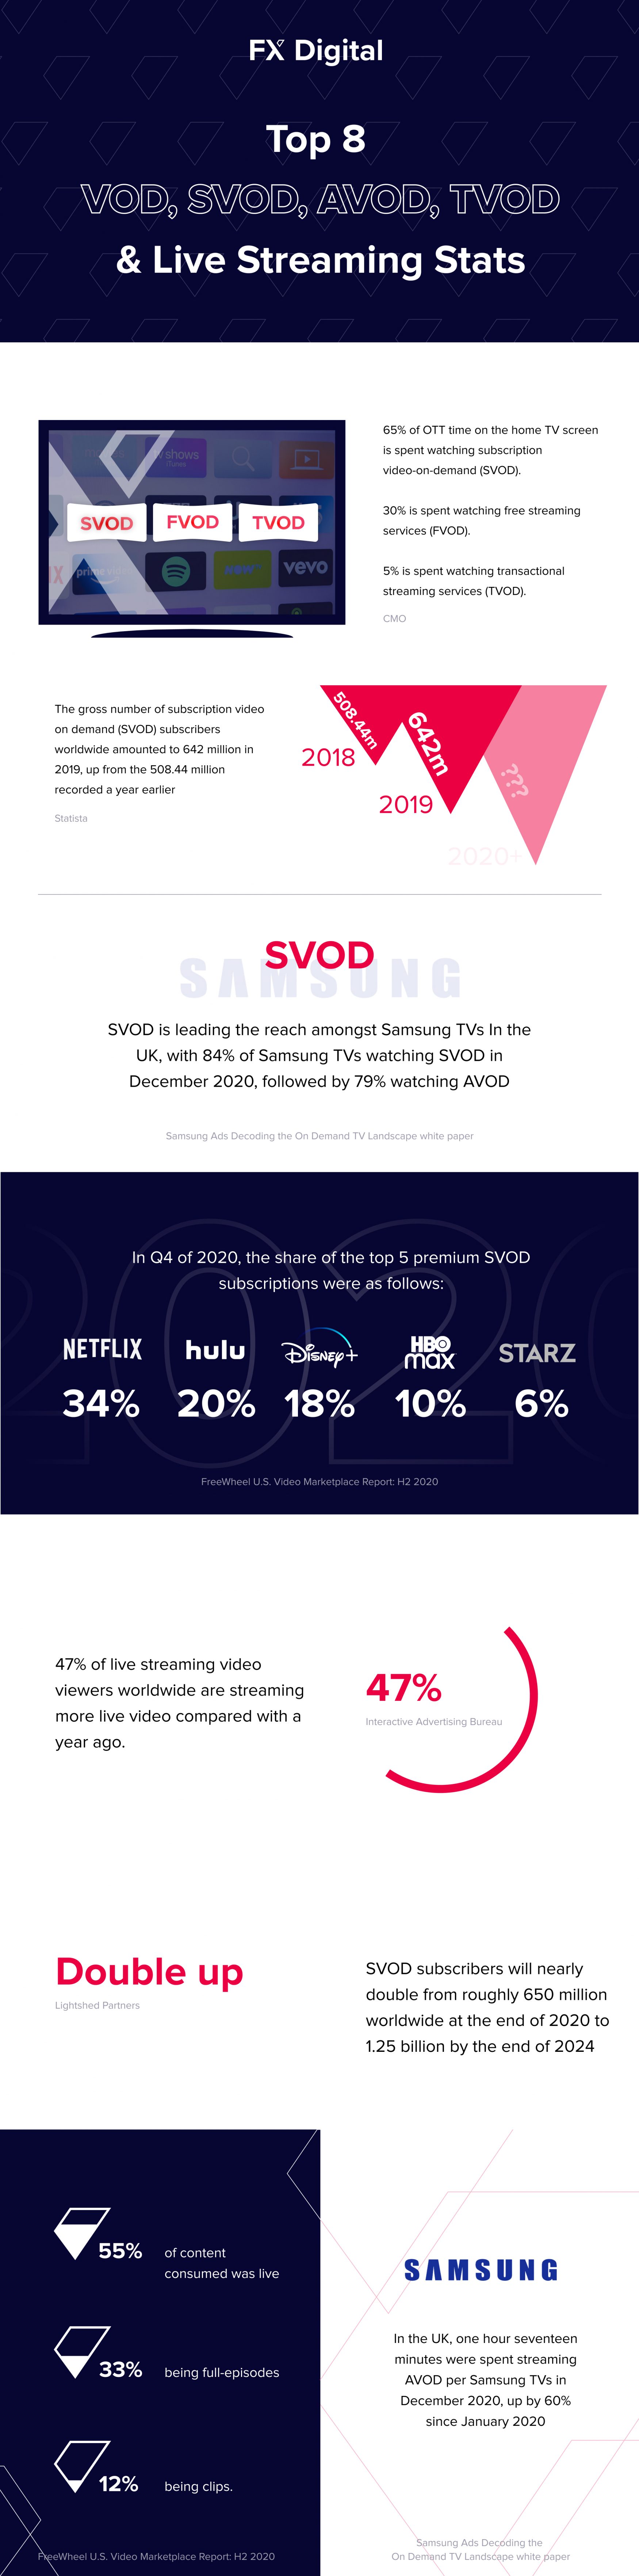
- In 2020, 55% of content consumed is live, with 33% being full-episodes, and 12% being clips (FreeWheel U.S. Video Marketplace Report: H2 2020)
- Between Q3 in 2019 and Q3 in 2020, there was a 42% growth in viewing time on Gaming Consoles (THEO Technologies via Conviva State of Streaming Q3 2020 report)
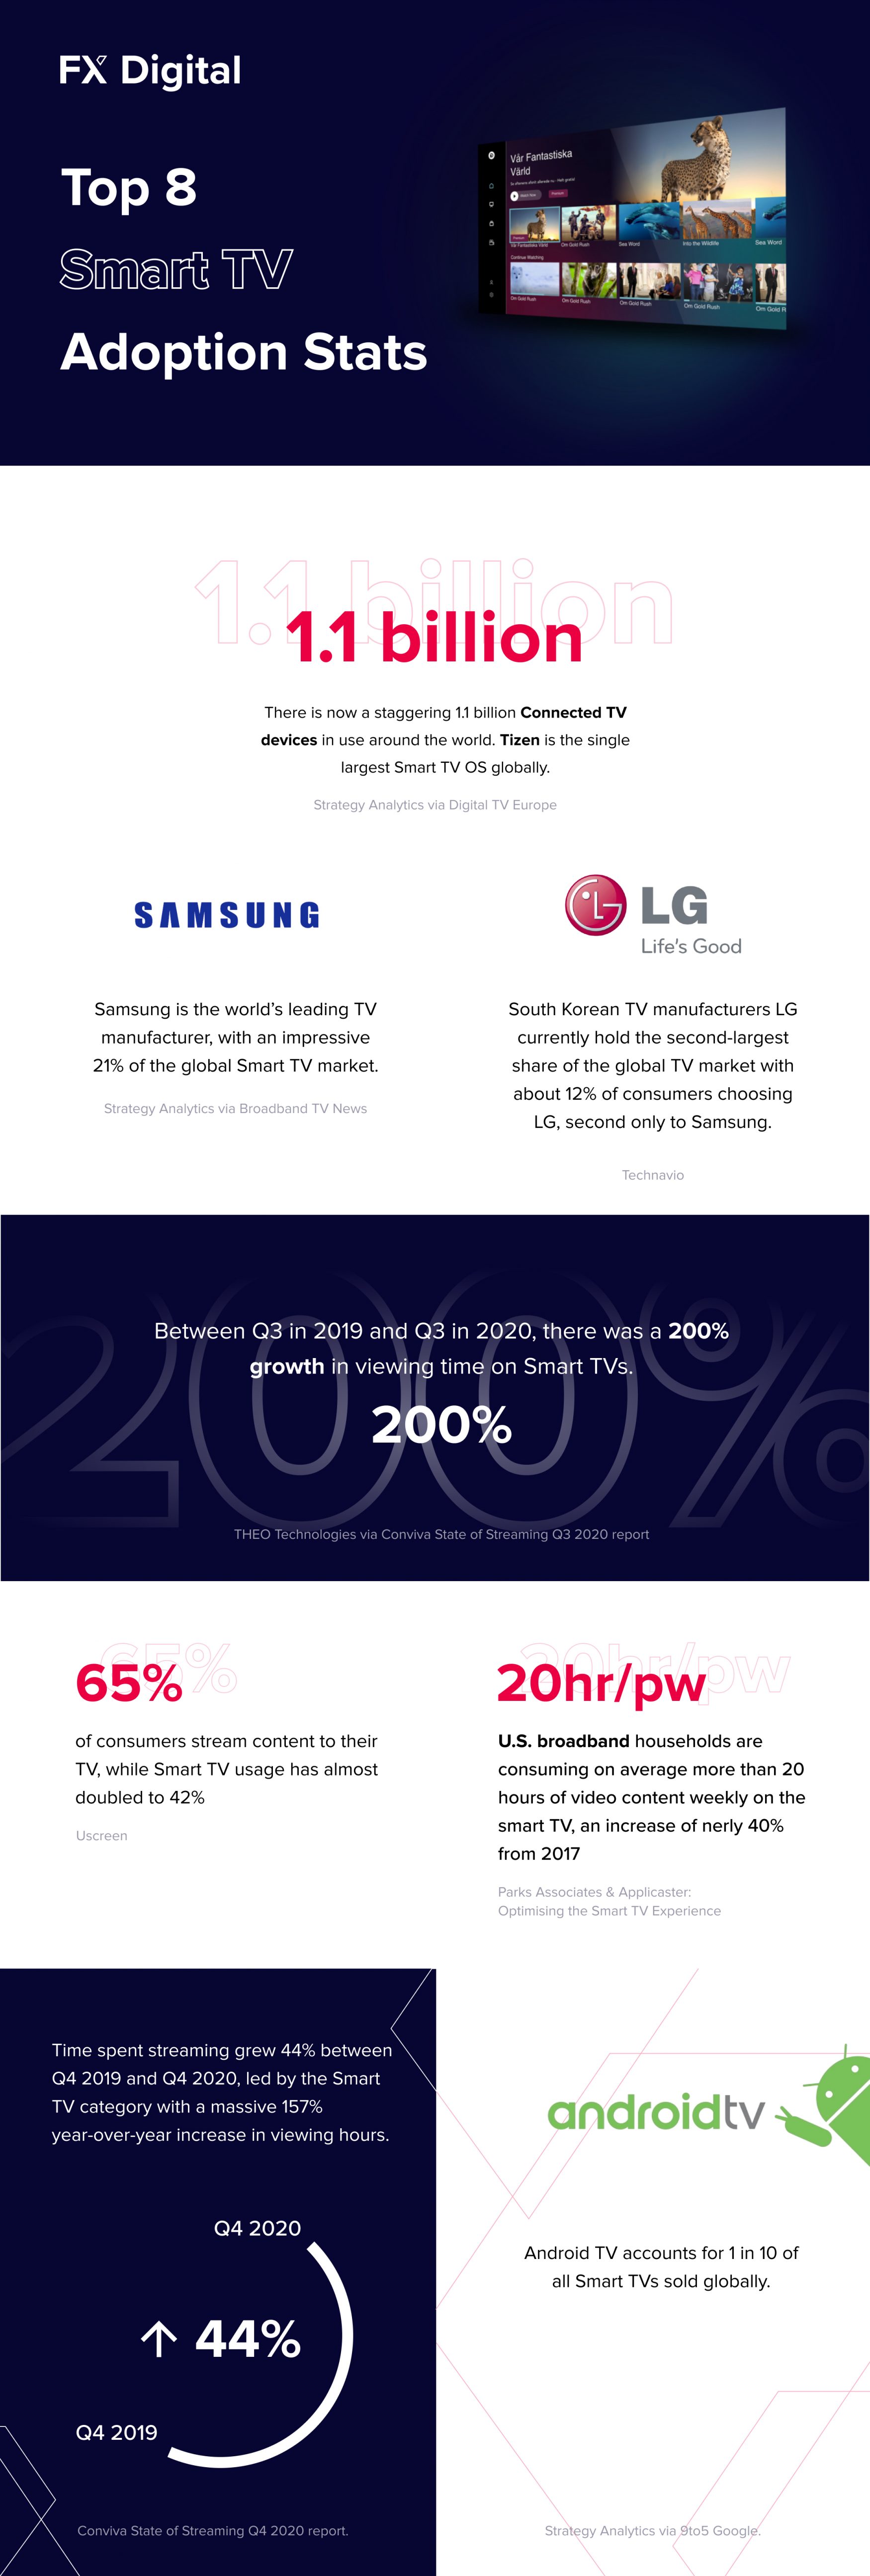
- Between Q3 in 2019 and Q3 in 2020, there was a 200% growth in viewing time on Smart TVs. (THEO Technologies via Conviva State of Streaming Q3 2020 report)
- Time spent streaming grew 44% between Q4 2019 and Q4 2020, led by the smart TV category with a massive 157% year-over-year increase in viewing hours (Conviva State of Streaming Q4 2020 Report)
- In the UK, two hours seven minutes were spent streaming SVOD per Samsung TVs in December 2020, up by 43% since January 2020 (Samsung Ads Decoding the On Demand TV Landscape white paper)
- Watch time for live content is up 250% (Think with Google)
- In March 2020, 22% of people in the U.S. and U.K. started streaming more live video since the outbreak, with 27% being male and 16% being female. (GWI coronavirus Research March 2020)
- Mid-March of 2020 saw increases of 44% in streaming time (Digital TV Europe)
- Overall, online streaming services have 65% market penetration in the UK, with total adoption up 7% since January 2020 (Digital TV Europe)
- In August 2020, 64% of UK video customers paid for two or more streaming services up from 50% in January 2020 (Digital TV Europe)
- Customers with four or more subscriptions have increased by 100% since January 2020, whereas the number of consumers with only one subscription has fallen by 18% (Digital TV Europe)
- There was a 160% growth in views on Connected TVs in Q2 of 2020 (Brightcove)
- In 2020, people watched more than 13.1 million days’ worth of media and enterprise content (Brightcove – 2020: An Evolutionary Year for Video)
- Entertainment saw a 252% increase in views on Connected TVs in 2020 compared to 2019 (Brightcove – 2020: An Evolutionary Year for Video)
- In Q4 of 2020, views of entertainment content saw strong increases in both views (+51%) and time watched (+50%) (Brightcove – 2020: An Evolutionary Year for Video)
- In Q4 of 2020, North America saw entertainment views increase by 39%, whereas time watched increased more than 65% (Brightcove – 2020: An Evolutionary Year for Video)
- In Q4 of 2020, entertainment views were up in India (+105%), Japan (+64%), Europe (+59%), Asia (+20%), and ANZ (+15%) year-over-year. Time watched saw big gains in Europe (+137%), Asia (+92%), and Japan (+57%) (Brightcove – 2020: An Evolutionary Year for Video)
- In 2020, 55% of content consumed is live, with 33% being full-episodes, and 12% being clips (FreeWheel U.S. Video Marketplace Report: H2 2020)
VOD, SVOD, AVOD, TVOD & Live Streaming
In a world where on-demand video streaming is slowly becoming the norm, the following statistics below break down the most crucial points that give a clear indication of the forthcoming growth of this space.
- Ofcom states that between 2014 and 2018 there has been a rapid adoption of SVOD services, with total UK subscriptions rising from 5.2m to 20m (Ampere Analysis via Ofcom)
- 65% of OTT time on the home TV screen is spent watching subscription video-on-demand (SVOD); 30% is spent watching free streaming services (FVOD); 5% is spent watching transactional streaming services (TVOD) (CMO)
- Viewers spend 8x longer with live video (43 minutes) than on-demand (5 minutes) (Tubular Insights)
- From January to March 2020, SVOD viewing in the U.S rose by 40% on average compared to the previous months (Reelgood)
- SVOD subscribers will nearly double from roughly 650 million worldwide at the end of 2020 to 1.25 billion by the end of 2024 (Lightshed Partners)
- 79% of U.S. households watch ad-supported and paid streaming services, compared to 76% who say they did so 6 months ago (Think with Google)
- In the UK in December 2020, SVOD share of streaming hours per Samsung TV was 55%, along with 29% for AVOD, 14% for BVOD, and just 2% for TVOD (Samsung Ads Decoding the On Demand TV Landscape white paper)
- In the UK, two hours seven minutes were spent streaming SVOD per Samsung TVs in December 2020, up by 43% since January 2020 (Samsung Ads Decoding the On Demand TV Landscape white paper)
- In the UK, one hour seventeen minutes were spent streaming AVOD per Samsung TVs in December 2020, up by 60% since January 2020 (Samsung Ads Decoding the On Demand TV Landscape white paper)
- SVOD is leading the reach amongst Samsung TVs In the UK, with 84% of Samsung TVs watching SVOD in December 2020, followed by 79% watching AVOD (Samsung Ads Decoding the On Demand TV Landscape white paper)
- In 2020, 55% of content consumed is live, with 33% being full-episodes, and 12% being clips (FreeWheel U.S. Video Marketplace Report: H2 2020)
- In Q4 of 2020, the share of the top 5 premium SVOD subscriptions were as follows: 34% Netflix, 20% Hulu, 18% Disney+, 10% HBO Max and 6% Starz (FreeWheel U.S. Video Marketplace Report: H2 2020)
- In March 2020, 56% of U.S. and U.K. live streamers planned to consume live video after the coronavirus outbreak (GWI coronavirus Research March 2020)
- 23% of consumers plan to continue watching more videos post-outbreak (GWI Flagship Report 2020)
- Younger consumers have taken to live streaming in the last few months due to coronavirus. 34% of GenZ’s used social media to keep up with news and current events (GWI Flagship Report 2020)
- 47% of live streaming video viewers worldwide are streaming more live video compared with a year ago (Interactive Advertising Bureau)
- 44% of consumers watch less live TV as a result of live streaming (Interactive Advertising Bureau)
- Live streamers are more interactive with brands and want greater influence over them (GWI 2020 Live Streaming Trends)
- Live stream events, on average, welcomed 20% of live streamers who couldn’t attend in-person events due to coronavirus (GWI 2020 Live Streaming Trends)
- The gross number of subscription video on demand (SVOD) subscribers worldwide amounted to 642 million in 2019, up from the 508.44 million recorded a year earlier (Statista)
Smart TV Adoption
With household penetration of Smart TVs rising a staggering 37% in the UK since 2015, it is expected that this penetration will continue in years to come as more of us adopt Smart TVs into our homes.
- There are now a staggering 1.1 billion Connected TV devices in use around the world. Tizen is the single largest Smart TV OS globally. (Strategy Analytics via Digital TV Europe)
- Smart TV sales have grown 23% since last year, whereas streaming boxes/sticks only grew 9%, and gaming consoles such as Xbox One and PS4 grew 8%. (Comcast via Advanced Television)
- Samsung is the world’s leading TV manufacturer, with an impressive 21% of the global Smart TV market. (Strategy Analytics via Broadband TV News)
- South Korean TV manufacturers LG currently hold the second-largest share of the global TV market with about 12% of consumers choosing LG, second only to Samsung (Technavio)
- Android TV accounts for 1 in 10 of all Smart TVs sold globally. (Strategy Analytics via 9to5 Google)
- Between Q3 in 2019 and Q3 in 2020, there was a 200% growth in viewing time on Smart TVs (THEO Technologies via Conviva State of Streaming Q3 2020 report)
- 65% of consumers stream content to their TV, while Smart TV usage has almost doubled to 42% (Uscreen)
- U.S. broadband households are consuming on average more than 20 hours of video content weekly on the smart TV, an increase of nearly 40% from 2017 (Parks Associates & Applicaster: Optimizing the Smart TV Experience)
- Time spent streaming grew 44% between Q4 2019 and Q4 2020, led by the smart TV category with a massive 157% year-over-year increase in viewing hours (Conviva State of Streaming Q4 2020 Report)
- 56% of viewing time on Samsung TVs in the UK was spent streaming by the end of 2020 (Samsung Ads Decoding the On Demand TV Landscape white paper)
Gaming Consoles
In recent years, we have seen drastic changes in the global video market with a rise in video consumption on gaming consoles such as Playstation, Xbox, Nintendo Switch and Wii. Here, we list some key stats surrounding this notable expansion of OTT onto gaming consoles.
- Third-party estimates put the Xbox One at around 50 million units, with Sony’s Playstation at 102.8 million beating it by roughly a 2:1 margin (Forbes)
- Between Q3 in 2019 and Q3 in 2020, there was a 42% growth in viewing time on Gaming Consoles (THEO Technologies via Conviva State of Streaming Q3 2020 report)
- Nearly 3.1 billion people worldwide play video games, which is about 40% of the world population (Game Rant)
- More than two-thirds of console owners stream over ten hours of live video content weekly (BridTV)
- In the US, there is a reported 162 million people who own video game consoles with the ability to watch TV, roughly half the US population (Marketing Charts)
Set-Top Boxes
Set-top boxes like Roku, Amazon Fire TV and Apple TV are continuing to grow in popularity due to the rising internet and broadband penetration and the growing preference for HD channels and on-demand video services, with these being factors expected to drive the market growth in the future. Below are some key Set-Top Box stats.
- In the US, Fire TV has an estimated 57% share of the streaming stick market and 28.5% share of the streaming box market (TDG via Fierce Video)
- Globally, Amazon Fire TV boasts over 40 million users (The Motley Fool)
- Fire TV also features on approximately 10% of global Smart TVs – a sizeable market share (Strategy Analytics via Digital TV Europe)
- Apple TV has 16% share of U.S. streaming TV devices (MacDailyNews)
- While in 2019 Roku only captured 4% of the Smart TV market, they continue to dominate the market share of streaming devices (Strategy Analytics via Digital TV Europe)
- In the US Roku makes up a huge 39% of all streaming devices (Parks Associates)
- In the US CTV now makes up 62% of all measured ad views, with Roku and Fire TV contributing 72% of ad views, 43% and 29% respectively (Rapid TV News)
- Amazon held the largest market share of the over-the-top (OTT) streaming boxes or sticks in the UK as of the third quarter of 2019, amounting to 36.5 percent of the total market (Statista)
- As of 2020, Roku has 51.2 million active accounts, with 41 million Roku devices in use (Expanded Ramblings)
- The Set-Top Box market size exceeded $17 billion in 2020 and is poised to grow at a CAGR of over 3% between 2021 and 2027 (Global Market Insights)
Key Revenue Stats
Within the OTT and Connected TV space, there are revenue forecasts and predictions that are set to exceed expectations, with the pandemic helping to fuel this growth. Below are some key statistics focused on revenue within this space and predictions as to the value of this space in time.
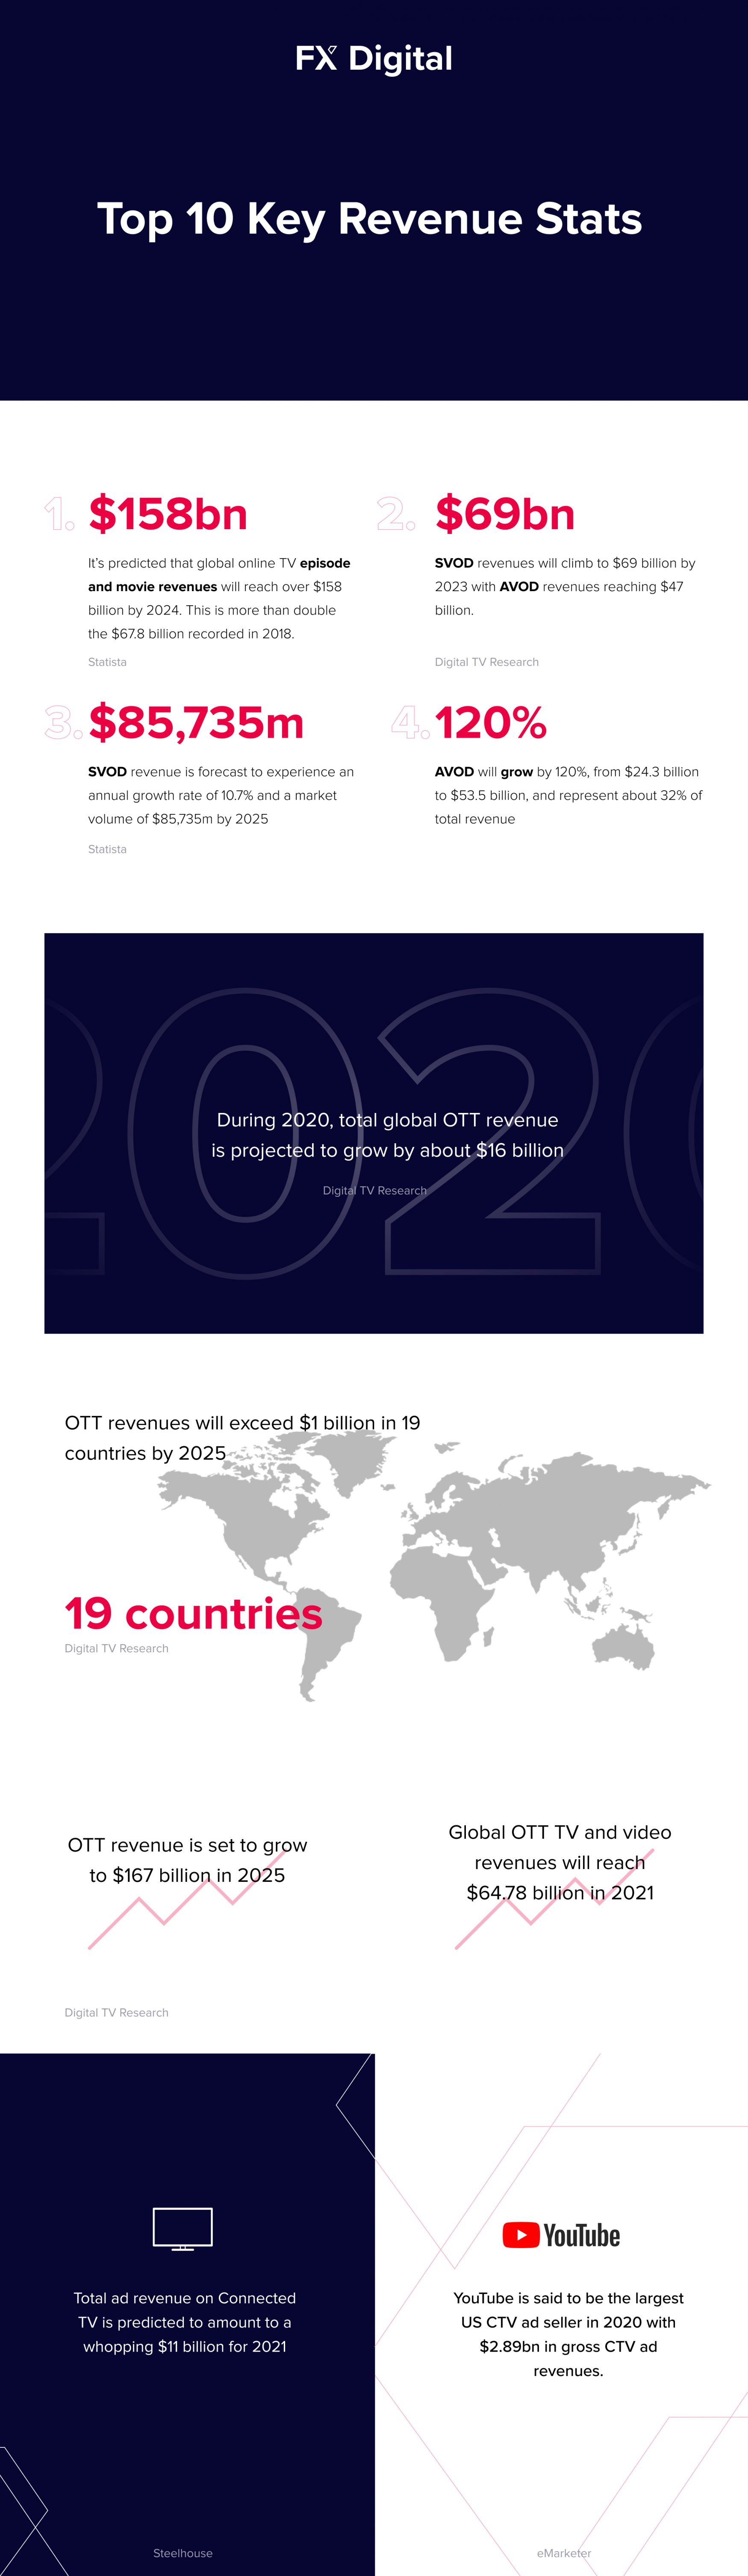
- It’s predicted that global online TV episode and movie revenues will reach over $158 billion by 2024. This is more than double the $67.8 billion recorded in 2018 (Statista)
- SVOD revenues will climb to $69 billion by 2023 with AVOD revenues reaching $47 billion (Digital TV Research)
- SVOD revenue is forecast to experience an annual growth rate of 10.7% and a market volume of $85,735m by 2025 (Statista)
- AVOD will grow by 120%, from $24.3 billion to $53.5 billion, and represent about 32% of total revenue (MediaPost)
- During 2020, total global OTT revenue is projected to grow by about $16 billion (Digital TV Research)
- OTT revenues will exceed $1 billion in 19 countries by 2025 (Digital TV Research)
- OTT revenue is set to grow to $167 billion in 2025 (Digital TV Research)
- Global OTT TV and video revenues will reach $64.78 billion in 2021 (Digital TV Research)
- Total ad revenue on Connected TV is predicted to amount to a whopping $11 billion for 2021 (Steelhouse)
- YouTube is said to be the largest US CTV ad seller in 2020 with $2.89 billion in gross CTV ad revenues (eMarketer)
Conclusion
Considering the growth of the OTT and Connected TV space in recent years, brands simply cannot afford to ignore its potential in the future. It has never been easier for people to consume content, and brands need to capitalise on this and tap into new markets to expand their audience reach, as the stats show just how crucial this means of content distribution is.
With the pandemic fuelling the growth of this space over the last year, we can expect to see more and more brands entering this space with revenues soaring across the board. Watch this space.